Average cricket bowling speed by age and level
By Rishi Gupta and Pradaksh Prasun · Published · Updated
Measured in published studies, selected boys aged 9–11 typically bowl 68–80 km/h (42–50 mph), bowlers aged 13–15 about 92–110 km/h (57–68 mph) and pathway bowlers aged 16–19 about 105–125 km/h (65–78 mph). Senior club bowlers average around 108 km/h; first-class and elite squads 122–127 km/h (76–79 mph). The range within every age is wide.
Average bowling speed at each age, at a glance
Each row gives what tested groups bowled in the studies on this page. Up to 14 the ages are single years; from 15 they are each group's average age, and the bowlers in a group spanned a wider range. They were selected bowlers, such as county squads, school first XIs and state pathway programmes, so read the speeds as what good young bowlers achieve, not the average child. How each group was measured is in the detailed table further down.
| Age (from 15: the group's average age) | Speed, km/h (mph) | Who was tested (study) |
|---|---|---|
| 9 (estimate) | 68 (43) typical | County-standard boys, England (Harwood 2018, estimate fitted to age) |
| 10–11 | 78–80 (49–50) | County-standard boys, England (Harwood 2018) |
| 12 | Not measured on its own: 80 (50) at 11 and 92 (57) at 13 | County-standard boys, England (Harwood 2018) |
| 13 (estimate) | 92 (57) typical; the best under-12 and under-13 bowlers averaged 95 (59) | County-standard boys, England (Harwood 2018) |
| 14 | 94–106 (58–66) typical at 14.0–14.3; 99.6 (62) fastest-ball average at 14.8 | County-standard boys, England (Harwood 2018); junior representative bowlers, Australia (Pyne et al. 2006) |
| About 15–16 | 109–110 (68–69) | Regional junior bowlers, Queensland (Doma et al. 2021); school first-XI bowlers, South Africa (Olivier et al. 2022) |
| About 16.5–17 | 105–119 (65–74) | Schoolboy bowlers, Johannesburg (Loram et al. 2005); state pathway bowlers, Australia (Andrews et al. 2024) |
| About 17 | 119 (74) | State-programme bowlers, New South Wales (Ferdinands et al. 2026) |
| About 18–19 (under-19) | 125 (77) for state under-17 and under-19 squads; 106–107 (66) held through an eight-over spell | Australia (Kiely et al. 2021; Callaghan et al. 2019) |
| Adult club | 108 (67) | Senior club bowlers, New Zealand (Petersen et al. 2004) |
| First-class and elite men | 122–127 (76–79) | Australia, England and South Africa (Pyne et al. 2006; Worthington et al. 2013; Wormgoor et al. 2010; Kiely et al. 2021) |
Junior bowling speeds by age: what the studies measured
The table collects the studies we could find that report measured ball speeds for junior pace bowlers with a stated age. None is a census. Each tested selected bowlers — county squads, representative sides, school first XIs or state pathway programmes — so read the figures as what good young bowlers achieve, not what every child of that age bowls.
The clearest age gradient comes from a Loughborough University thesis on 24 county-standard boys aged 9 to 14 in England, each of whom bowled 24 deliveries indoors. A motion-capture system measured the 14 youngest, aged 9.2 to 11.1, as they bowled 12 balls at their usual pace on each of two pitch lengths. Their speed was about the same on both. The 10 oldest, aged 12.7 to 14.3, were timed by radar. Fitting a straight line to speed against age across all 24 boys, the thesis estimated a typical (median) delivery of 19.0 m/s (68 km/h) at age 9, 22.3 m/s (80 km/h) at 11 and 25.6 m/s (92 km/h) at 13. No boy was aged between 11.1 and 12.7, which is where the measuring method changes, so the line joins speeds measured in two different ways. The four oldest boys, aged 14.0 to 14.3, had typical speeds of 94–106 km/h.
From about 15 the data come from representative and pathway squads, and the spread widens rather than narrows. Ninety-two bowlers in an Australian state youth pathway programme, average age 16.9, averaged 119 km/h on radar. South African school first-XI bowlers, average age 15.9, averaged 109 km/h with a standard deviation of 11.8 km/h — bowlers one standard deviation either side of the mean were more than 20 km/h apart.
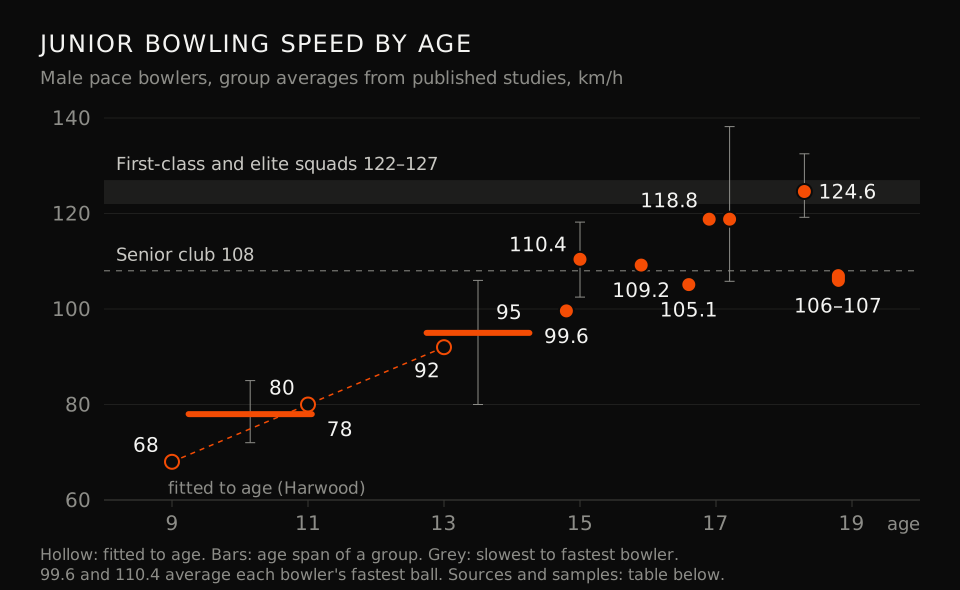
| Age (years) | Who was tested | n | Speed, km/h (mph) | How measured | Study |
|---|---|---|---|---|---|
| 9 (estimate) | County-standard seam bowlers, England | 24 aged 9–14 | 68 (43) typical; 73 (45) fastest | Line fitted to age across both groups below (motion capture to age 11.1, radar from 12.7); 24 balls each | Harwood 2018 |
| 11 (estimate) | County-standard seam bowlers, England | 24 aged 9–14 | 80 (50) typical; 84 (52) fastest | Line fitted to age across both groups below (motion capture to age 11.1, radar from 12.7); 24 balls each | Harwood 2018 |
| 13 (estimate) | County-standard seam bowlers, England | 24 aged 9–14 | 92 (57) typical; 95 (59) fastest | Line fitted to age across both groups below (motion capture to age 11.1, radar from 12.7); 24 balls each | Harwood 2018 |
| 9.2–11.1 | County-standard under-10 and under-11 seam bowlers, England | 14 | 78 (49) average of each bowler's median; range 72–85 (45–53) | Motion capture at 300 Hz, indoors; 24 balls each, 12 on each of two pitch lengths, at usual pace | Harwood 2018 (our calculation from its Table G.1) |
| 12.7–14.3 | Best under-12 and under-13 seam bowlers nominated by counties, England | 10 | 95 (59) average of each bowler's median; range 80–106 (50–66) | Radar, 24 balls each | Harwood 2018 (our calculation from its Table G.1) |
| 14.8 ± 1.3 | Junior representative fast bowlers, Australia | 48 | 99.6 (61.9), average of each bowler's fastest | Not stated in the abstract | Pyne et al. 2006 |
| 15 ± 1.7 | Regional-level junior fast bowlers, Queensland | 8 | 110.4 (68.6), average of each bowler's fastest; range 102.5–118.2 | Laser speed device | Doma et al. 2021 |
| 15.9 ± 1.2 (13–18) | School first-XI pace bowlers, South Africa | 46 | 109.2 ± 11.8 (67.9), average of 6 balls | Radar | Olivier et al. 2022 |
| 16.6 ± 0.7 | Schoolboy fast-medium bowlers, Johannesburg | 12 | 105.1 (65.3) | Video at 250 fps, 3 balls each | Loram et al. 2005 |
| 16.9 ± 1.3 | State youth pathway fast bowlers, Australia | 92 | 118.8 (73.8), average of 6 balls | Radar | Andrews et al. 2024 |
| 17.2 ± 1.7 | Regional and New South Wales state-programme fast bowlers | 18 | 118.8 (73.8); range 105.8–138.2 | 3D motion capture | Ferdinands et al. 2026 |
| 18.3 ± 1.1 | State under-17 and under-19 squad fast bowlers, Australia | 9 | 124.6 (77.4); range 119.2–132.5 | Radar | Kiely et al. 2021 |
| 18.8 ± 1.7 | State pathway or premier-grade pace bowlers, Australia | 9 | 106–107 (66) through an eight-over spell | Radar, 48 maximum-effort balls | Callaghan et al. 2019 |
Senior and elite bowling speeds
For adults the useful split is level, not age. Senior club bowlers in a New Zealand study averaged 108 km/h on radar. Australian first-class seniors averaged a best ball of 126.7 km/h, against 99.6 km/h for the juniors tested alongside them, and high-performance and elite squads in Australia, South Africa and England averaged 122–126 km/h in testing. How these compare with spinners is in cricket ball speed by type of bowler.
These are testing figures — often recorded indoors with motion capture, or with a radar lined up behind the bowler — averaged across a whole squad. They are not directly comparable with a single match-day reading on a broadcast speed gun, and the range inside an elite group is wide: England's elite fast-bowling group ran from 118 to 143 km/h.
Women bowl slower at every level studied. England's elite women fast bowlers averaged 100 km/h against 126 km/h for elite men tested the same way, and the authors link part of the gap to the women carrying less momentum from the run-up. Ireland's high-performance women pace bowlers averaged 83 km/h.
| Age (years) | Who was tested | n | Speed, km/h (mph) | How measured | Study |
|---|---|---|---|---|---|
| Adults (age not in abstract) | Senior club bowlers, New Zealand | 16 | 108 ± 5 (67.1) | Radar, 18 balls each | Petersen et al. 2004 |
| 24.9 ± 3.3 | State premier (top-grade club) fast bowlers, Australia | 7 | 123.1 (76.5) | Radar | Kiely et al. 2021 |
| 26.0 ± 4.4 | State squad fast bowlers, Australia | 4 | 122.4 (76.1) | Radar | Kiely et al. 2021 |
| 23.9 ± 4.8 | First-class senior fast bowlers, Australia | 24 | 126.7 (78.7), average of each bowler's fastest | Not stated in the abstract | Pyne et al. 2006 |
| 22.0 ± 3.0 | High-performance fast bowlers, South Africa | 28 | 122.4 (76.1) | Video at 50 Hz, one delivery each | Wormgoor et al. 2010 |
| 20.1 ± 2.6 | ECB elite fast-bowling group, England (current or likely internationals) | 20 | 125.6 (78.1); range 118.1–142.9 (73.4–88.8) | Motion capture at 300 Hz, indoors | Worthington et al. 2013 |
| 19.9 ± 3.2 | Elite women fast bowlers, England (senior, A and under-19 squads) | 20 | 100.4 (62.4) | Motion capture at 300 Hz, indoors | Felton et al. 2019 |
| 22.3 ± 4.7 | High-performance women pace bowlers, Ireland | 11 | 82.8 (51.4); range 73.1–95.0 | Radar | Lyons et al. 2023 |
What counts as fast: the reference points
There is no official speed classification. Cricinfo's long-running list of international bowling speeds says plainly that its thresholds are arbitrary: reaching 140 km/h makes a 'qualified fast' bowler, above 145 km/h a genuine speedster, and 150 km/h is the benchmark for express pace. A sports-science review cites a similar split from the research literature, placing elite fast bowlers at 36–40.5 m/s (about 130–146 km/h) and rare express bowlers above that.
At the very top, Guinness World Records lists 161.3 km/h (100.23 mph), bowled by Shoaib Akhtar against England at Newlands in the 2003 World Cup, as the fastest electronically measured delivery — while noting the ICC's view that speed guns are not uniform enough for any one reading to be official.
Set against the measured data above, those labels describe the top of the professional game. Even England's elite group averaged 126 km/h in testing, and its fastest bowler reached 143 km/h.
| Label | km/h | mph | Source and status |
|---|---|---|---|
| Qualified fast | 140 | 87 | Cricinfo international speeds list; its compiler calls the thresholds arbitrary and the list unofficial |
| Genuine speedster | Above 145 | Above 90 | Cricinfo, as above |
| Express pace | 150 | 93 | Cricinfo, as above |
| Elite fast (research classification) | 130–146 (36–40.5 m/s) | 81–91 | Glazier et al. (2000), as cited in Johnstone et al. (2014) |
| Express (research classification) | Above 146 (40.5 m/s) | Above 91 | As above |
| Fastest recognised delivery | 161.3 | 100.23 | Guinness World Records: Shoaib Akhtar, 22 February 2003 |
Why studies disagree, and how to compare yourself fairly
Take two Australian pathway groups of almost the same age. State under-17 and under-19 bowlers averaged 124.6 km/h in one study; state-pathway and premier-grade bowlers averaged 106–107 km/h through an eight-over spell in another. Both used radar. The studies differ in what was asked of the bowlers — testing deliveries in one, 48 maximum-effort balls in a spell in the other — and in who was selected.
Four things move a published number: whether it is each bowler's fastest ball or an average of several; the instrument (a radar behind the bowler, high-speed video, or marker-based motion capture); the setting (lab, nets or match); and selection — a county squad is not a random sample of 13-year-olds.
So compare like with like. To check a junior against these tables, record six full-effort deliveries, note both the average and the fastest, keep the set-up the same every time, and compare fastest with fastest and average with average.
Why speed rises with age, and varies so much within one
Size and strength explain much of the jump from junior to senior. In the Australian comparison of 48 junior and 24 first-class bowlers, the seniors carried about 12 kg more estimated muscle mass (40.0 kg against 28.3 kg), and the authors concluded that the junior–senior difference in speed related primarily to body mass and upper-body strength. Among the juniors, static jump, bench throw, body mass, percentage muscle mass and height together predicted peak speed closely (multiple correlation r = 0.86).
Growth timing varies by years between children of the same age, so two 14-year-olds can sit far apart in the table for reasons that have nothing to do with skill. Cricket Australia notes that the lower back is particularly vulnerable in the two to three years after the main growth spurt — often just as bowlers start bowling faster.
Technique is the other half. A meta-analysis of 18 studies found that run-up speed correlated strongly with release speed (r = 0.50) and front-knee angle at release moderately (r = 0.40); arm length (r = 0.65) and shoulder strength (r = 0.58) also correlated strongly. In England's elite group, four technique variables explained 74% of the variation in speed: the fastest bowlers ran in quicker, kept the front knee straighter through front-foot contact, flexed the upper trunk more up to release and delayed the arm's circumduction.
The front leg matters at every level. A straighter front knee at front-foot strike went with faster balls in South African schoolboys (r = 0.72); in Australian high-performance bowlers, faster bowlers extended the front knee through front-foot contact and produced higher braking forces; and in English elite bowlers a larger braking impulse at the front foot went with higher speed (r = 0.574). All three fit the same picture of the kinetic chain: the run-up's momentum is checked at a firm front leg and passed up through the trunk to the arm.
Sprinting ability shows up too. In 20 Australian professional, academy and premier-grade bowlers, the duration of the bowling action and the 10–30 m sprint split together explained 54% of the variation in ball speed.
How to measure your own speed accurately
A radar gun is the reference instrument, but not a perfect one. Researchers using a common sports radar quote its accuracy as ±3%, about ±1 m/s (±3.5 km/h) at typical fast-bowling speeds, and it has to be lined up with the ball's path, behind the bowler or behind the stumps.
Without a radar, measure from phone video. Our guide to checking bowling speed on your phone explains how stump-calibrated tracking works, and the Stance bowling speed calculator turns a frame count from your own slow-motion clip into km/h and mph with an error band. Several kinds of app also measure speed from phone video: our guide to bowling speed apps explains how each type measures, and how Stance compares with other cricket apps sets out what Stance measures.
Two rules keep phone figures comparable with these tables. Film at 120 or 240 fps if your phone offers it: at 30 fps a single frame of timing error is worth about ±6% on a 120 km/h ball. And a speed averaged over the ball's whole path, bounce included, reads lower than the release speed a radar reports, so treat a video figure as a conservative estimate.
Workload limits for junior fast bowlers
Bowling faster than your age group is not a reason to bowl more. Cricket Australia's 2026 guidelines say around one in three adolescent pace bowlers suffers a lumbar bone stress injury, and list bowlers who are taller or faster than their peers, or who have just had a growth spurt, as more vulnerable.
In England and Wales the limits are mandatory for players aged 19 and under in hardball recreational cricket; county Academy and Emerging Player Programme players follow their own protocols. Limits go by the bowler's age, not the age group they are playing in. Deliveries bowled at or near match intensity in training count, and after a spell a bowler must rest until the same number of overs has been bowled from that end.
Cricket Australia's community guidelines add training rules. Under-17s should follow '1, 3, 5': at least a day off bowling after a bowling day, no more than three bowling days a week, and no spell longer than five overs. Bowlers aged 17–19 follow '2, 4, 6'. Both build bowling up gradually before a season, from two weeks for under-13s to eight weeks for 17–19-year-olds.
The research behind such limits: in a season-long study of 44 Australian junior fast bowlers, average age 14.7, those who averaged fewer than 3.5 rest days between bowling days were 3.1 times as likely to sustain an overuse injury as those who rested longer.
We could not find a published BCCI equivalent. In India, follow your state association's or tournament's rules, and treat the ECB and Cricket Australia limits as a sensible reference.
| Governing body | Age (years) | Max overs per spell | Max overs per day |
|---|---|---|---|
| ECB (mandatory) | 11 and under | 4 | 8 |
| ECB (mandatory) | 12–13 | 5 | 10 |
| ECB (mandatory) | 14–15 | 5 | 12 |
| ECB (mandatory) | 16–17 | 6 | 15 |
| ECB (mandatory) | 18–19 | 7 | 18 |
| Cricket Australia (guideline) | Under 11 | 2 | 4 |
| Cricket Australia (guideline) | 11–13 | 4 | 8 |
| Cricket Australia (guideline) | 13–15 | 5 | 12 |
| Cricket Australia (guideline) | 15–17 | 5 | 16 |
| Cricket Australia (guideline) | 17–19 | 6 | 18 |
What Stance's own data shows
Stance will extend these tables with aggregated, anonymised speeds from sessions uploaded to the app, grouped by age band and playing level. It will cover players aged 13 and over, the minimum age for using Stance.
A group will appear only once it holds enough bowlers and sessions for its average to be stable, every figure will carry its sample size, and no individual's data will ever be shown. Until then this page reports published research only.
Common questions
- How fast should a 13-year-old bowl?
- There is no target speed. In an English study of county-standard boys, the typical speed at 13 was about 92 km/h (57 mph), and the best under-12 and under-13 seam bowlers nominated by counties averaged 95 km/h (59 mph), with a range of 80–106 km/h (50–66 mph). These were selected bowlers, so most 13-year-olds bowl slower, and growth timing makes a large difference at this age.
- How fast should a 14-year-old bowl?
- There is no target speed, but the studies give a guide. County-standard boys aged 14.0–14.3 in an English study had typical speeds of 94–106 km/h (58–66 mph), and Australian junior representative bowlers averaging 14.8 years had an average best ball of 99.6 km/h (62 mph). Growth timing makes a large difference at this age, so a later-maturing 14-year-old well below these figures is normal.
- How fast should a 15-year-old bowl?
- Two tested groups averaging 15 to 16 years bowled 109–110 km/h (68–69 mph): Queensland regional junior fast bowlers, average age 15, averaged 110.4 km/h for their fastest ball, and South African school first-XI pace bowlers, average age 15.9, averaged 109.2 km/h over six balls. Both were selected bowlers, and the spread was wide: the South African group's standard deviation was 11.8 km/h.
- How fast should a 16-year-old bowl?
- Measured groups aged 15 to 17 averaged roughly 105–119 km/h (65–74 mph): 105 km/h for Johannesburg schoolboys aged 16.6, 109 km/h for South African school first-XI bowlers averaging 15.9, and 119 km/h for 92 Australian state-pathway bowlers averaging 16.9. The spread within each group was wide — in the South African group the standard deviation alone was 11.8 km/h.
- How fast do 12-year-olds bowl?
- In the one study with a clear age gradient, the typical speed of England county-standard boys rose from 80 km/h at 11 to 92 km/h at 13, which puts a county-standard 12-year-old at about 86 km/h (53 mph), midway between the study's two straight-line estimates. These were among the best bowlers in their age groups, so treat the figure as a high benchmark rather than a typical club speed.
- What is the average bowling speed in cricket?
- It depends on level. In published testing, senior club bowlers averaged 108 km/h (67 mph), and first-class and elite squads 122–127 km/h (76–79 mph). The labels used for international pace start higher: Cricinfo's speed list treats 140 km/h, by its own admission arbitrarily, as the threshold for a fast bowler.
- How fast do under-19 bowlers bowl?
- Australian state under-17 and under-19 squad fast bowlers, average age 18.3, averaged 124.6 km/h (77.4 mph), with a range of 119.2–132.5 km/h. Pathway and premier-grade bowlers averaging 18.8 held 106–107 km/h (66 mph) through an eight-over spell of maximum-effort balls, a reminder that a single fastest ball reads higher than a spell average.
- What is the average bowling speed in men's cricket?
- In published testing, senior men's club bowlers averaged 108 km/h (67 mph), and first-class and elite men's squads 122–127 km/h (76–79 mph). International fast bowlers sit higher: Cricinfo's speed list treats 140 km/h (87 mph), by its own admission arbitrarily, as the threshold for a fast bowler.
- What is the average bowling speed in women's cricket?
- In testing, England's elite women fast bowlers averaged 27.9 m/s (100 km/h, 62 mph) and Ireland's high-performance women pace bowlers 23.0 m/s (83 km/h, 51 mph). We found no published study of junior girls' bowling speeds by age.
- Can anyone bowl 180 km/h?
- No bowler has been reliably measured anywhere near it. The fastest delivery recognised by Guinness World Records is 161.3 km/h (100.23 mph), by Shoaib Akhtar in 2003, and Guinness notes the ICC's view that speed guns are not uniform enough for any single reading to be official. Treat any reading far above that with suspicion and check the instrument first.
Sources
- Harwood (2018) — Scaling the pitch for junior cricketers, PhD thesis, Loughborough University (ball speeds of county-standard boys aged 9–14, by motion capture at 9–11 and radar at 12–14)
- Pyne et al. (2006) — Anthropometric and strength correlates of fast bowling speed in junior and senior cricketers, J Strength Cond Res
- Doma et al. (2021) — Exercise-induced muscle damage and bowling-specific skills in male adolescent cricketers, Sports
- Olivier, Olivier & Mnguni (2022) — Trunk muscle stability and performance in adolescent pace bowlers, S Afr J Sports Med
- Loram et al. (2005) — Determinants of ball release speed in schoolboy fast-medium bowlers, J Sports Med Phys Fitness
- Andrews, Gorman & Crowther (2024) — Functional movement variability to maintain delivery speed in cricket fast bowling, Eur J Sport Sci
- Ferdinands et al. (2026) — Front leg mechanics in junior fast bowlers: a 3D motion analysis study, Sensors
- Kiely et al. (2021) — The influence of technique and physical capacity on ball release speed in cricket fast-bowling, J Sports Sci (accepted manuscript)
- Callaghan et al. (2019) — The effects of an eight-over spell on pace bowling biomechanics and performance, Sports
- Petersen, Wilson & Hopkins (2004) — Effects of modified-implement training on fast bowling in cricket, J Sports Sci
- Wormgoor, Harden & McKinon (2010) — Predictors of ball release speed in high-performance fast bowlers, J Sports Sci
- Worthington, King & Ranson (2013) — Relationships between fast bowling technique and ball release speed in cricket, J Appl Biomech
- Felton et al. (2019) — Comparison of biomechanical characteristics between male and female elite fast bowlers, J Sports Sci
- Lyons, Felton & McCabe (2023) — Female cricket pace bowling: kinematic and anthropometric relationships with ball release speed, S Afr J Sports Med
- King, Worthington & Ranson (2016) — Does maximising ball speed in fast bowling necessitate higher ground reaction forces?, J Sports Sci
- Portus et al. (2004) — Technique factors related to ball release speed and trunk injuries in high-performance fast bowlers, Sports Biomech
- Ramachandran et al. — Biomechanical and physical determinants of bowling speed in cricket: systematic review and meta-analysis, Sports Biomech
- Johnstone et al. (2014) — The athletic profile of fast bowling in cricket: a review, J Strength Cond Res (author manuscript)
- Cricinfo — International bowling speeds (compiled by Eddie Smith; unofficial)
- Guinness World Records — Fastest delivery of a cricket ball (male)
- ECB — Recreational Cricket Safety Regulations (effective 17 December 2025), Regulation 5: Fast bowling
- Cricket Australia — Community Cricket Junior Pace Bowling Workload Guidelines (2026)
- Dennis, Finch & Farhart (2005) — Is bowling workload a risk factor for injury to Australian junior cricket fast bowlers?, Br J Sports Med